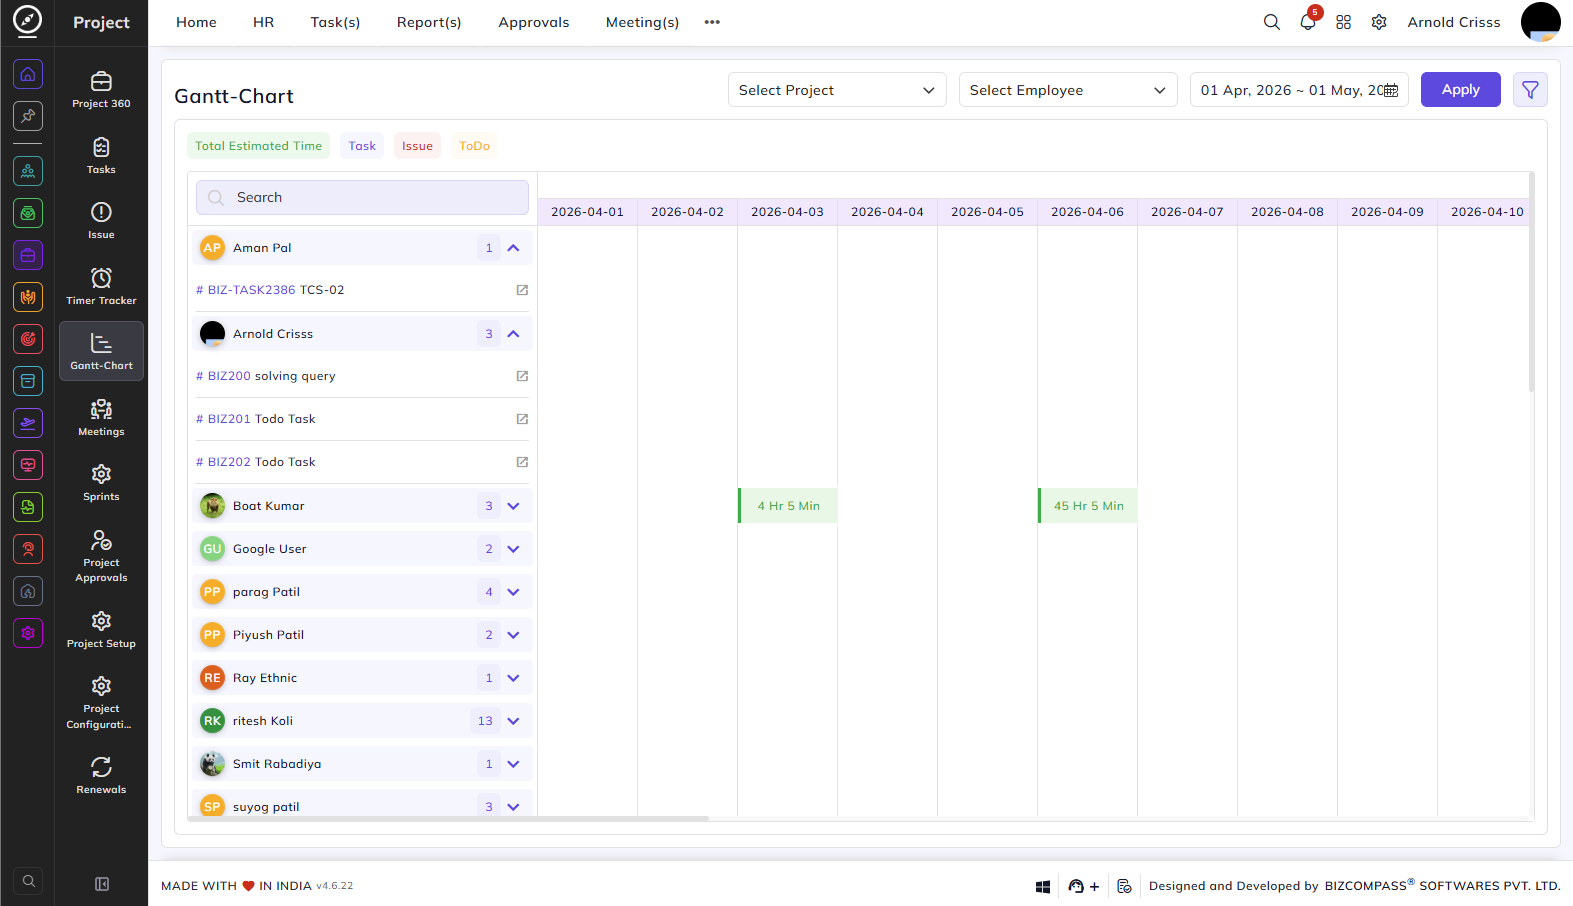
Gantt-Chart
From this page, you can visualize the time distribution of tasks, issues, and todos across team members on a date-based timeline. The Gantt Chart provides a clear overview of who is working on what and when, helping managers track workload and identify scheduling gaps.
Filters:
Select Project:
Filter the chart to show entries from a specific project.
Select Employee:
Filter the chart to show entries for a specific employee.
Date Range:
Select the date range for the timeline view.
Apply:
Click to apply the selected filters.
View Tabs:
The chart supports three types of entries that can be toggled on or off by clicking on their respective tabs:
- Task — shows tasks assigned to each employee.
- Issue — shows issues assigned to each employee.
- ToDo — shows todos assigned to each employee.
Clicking on any of these tabs selects or deselects that entry type from the chart view, allowing you to focus on specific types of work. The Total Estimated Time indicator at the top left shows the combined estimated time for all visible entries.
Chart View:
The left panel lists all employees along with the count of their assigned entries. Each employee row can be expanded or collapsed using the arrow icon to show or hide their individual tasks, issues, or todos. A search bar at the top allows you to quickly find a specific employee or task.
The right panel displays the timeline, with each date shown as a column. Logged time for each employee is represented as colored bars on the corresponding date, showing the duration of work. Clicking the external link icon next to any task or todo opens its detail view directly.