Project 360
The Project 360 page provides a comprehensive 360-degree view of a selected project, displaying its details, task and issue counts, and a range of charts and reports across multiple tabs.
At the top of the page, the following project details are displayed:
Customer(s):
The customer(s) associated with the project.
Project Time Slot:
The start and end date of the project.
Project Alert(s):
Click the eye icon to view any alerts configured for the project.
Platform(s):
The platforms the project is built for.
Budget:
The total budget allocated for the project.
Description:
A brief description of the project.
Project People(s):
Shows the count of Managers, QAs, and Assignees on the project.
Below the details, a summary bar displays the count of Open Tasks, Pending Tasks, Completed Tasks, Reported Issues, Resolved Issues, Reopen Issues, and Issues Verified for the project.
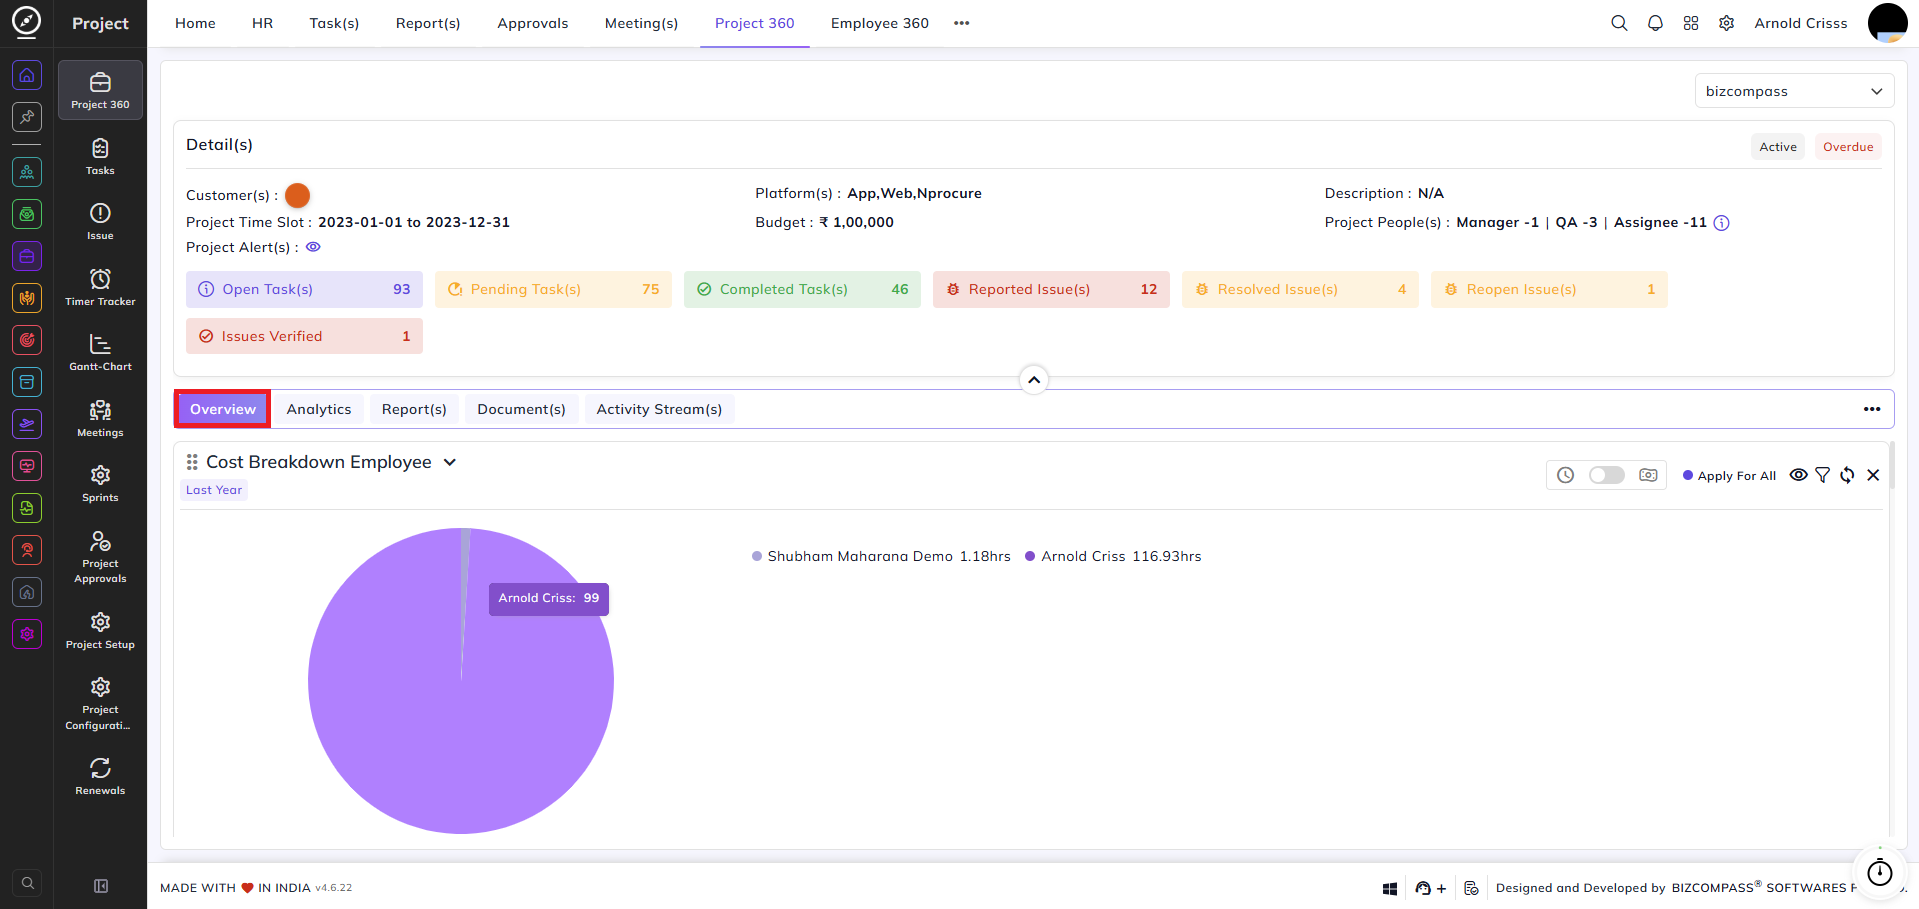
Overview Tab:
The Overview tab contains several charts providing a visual summary of the project's cost, time, team, and sprint data.
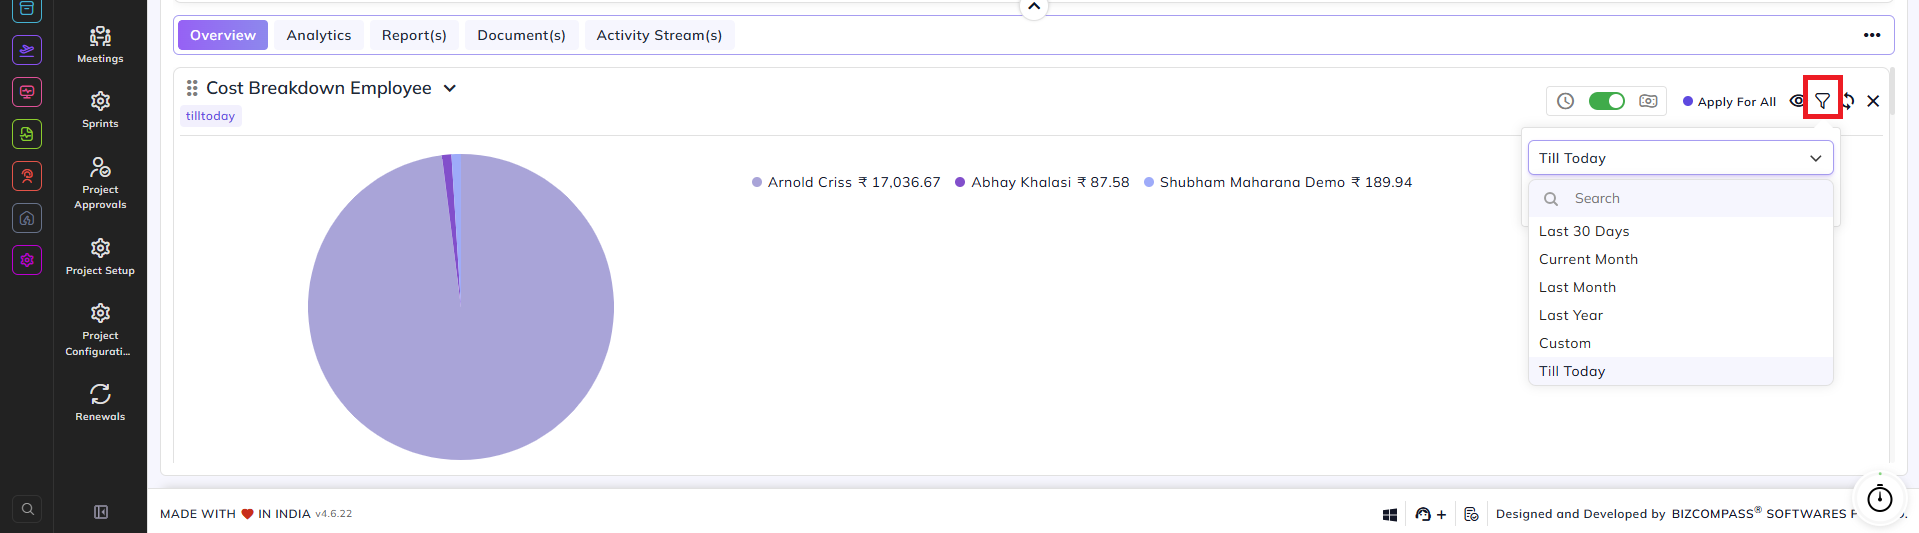
Cost Breakdown Employee:
A pie chart showing hours logged (or cost, when Cost Wise toggle is enabled) broken down by each team member. Click the dropdown arrow on the chart title to switch between Cost Breakdown Department, Cost Breakdown Designation, and Cost Breakdown Module views.
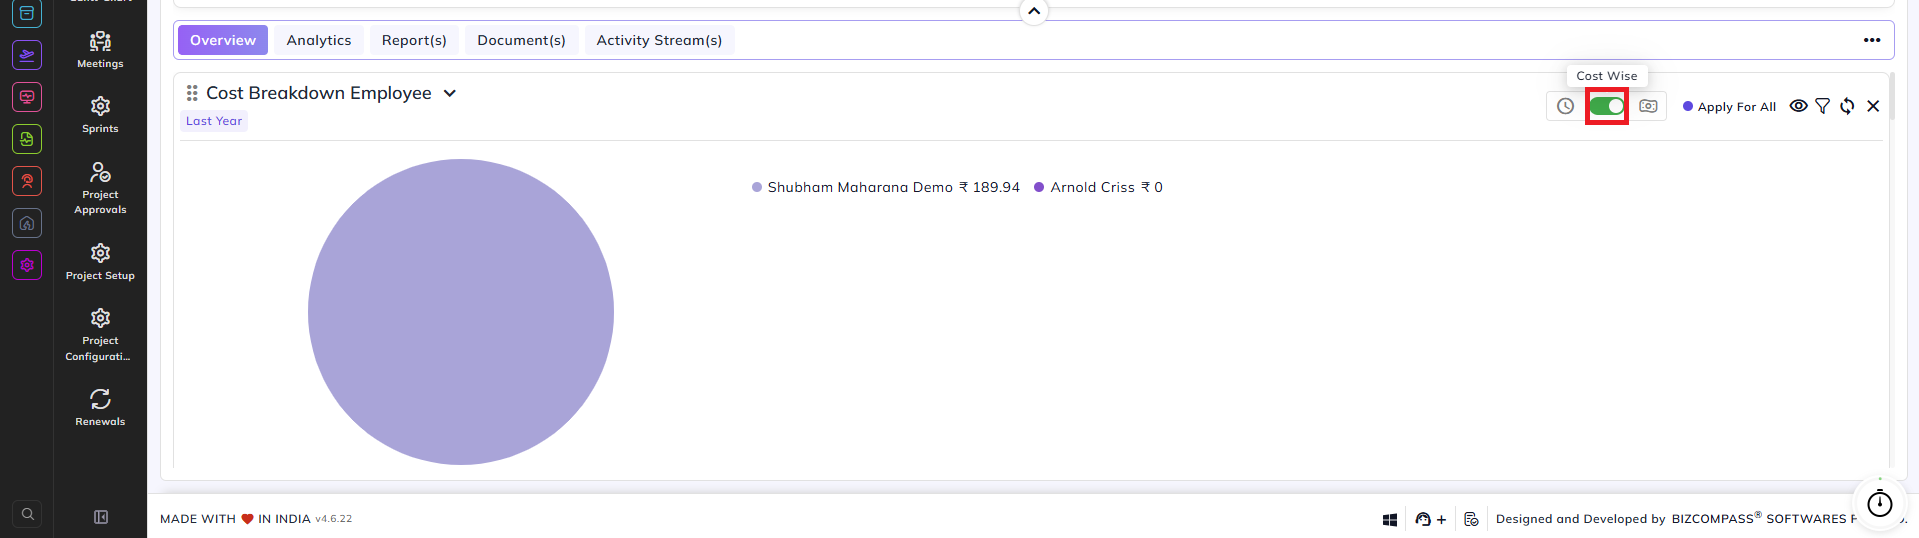
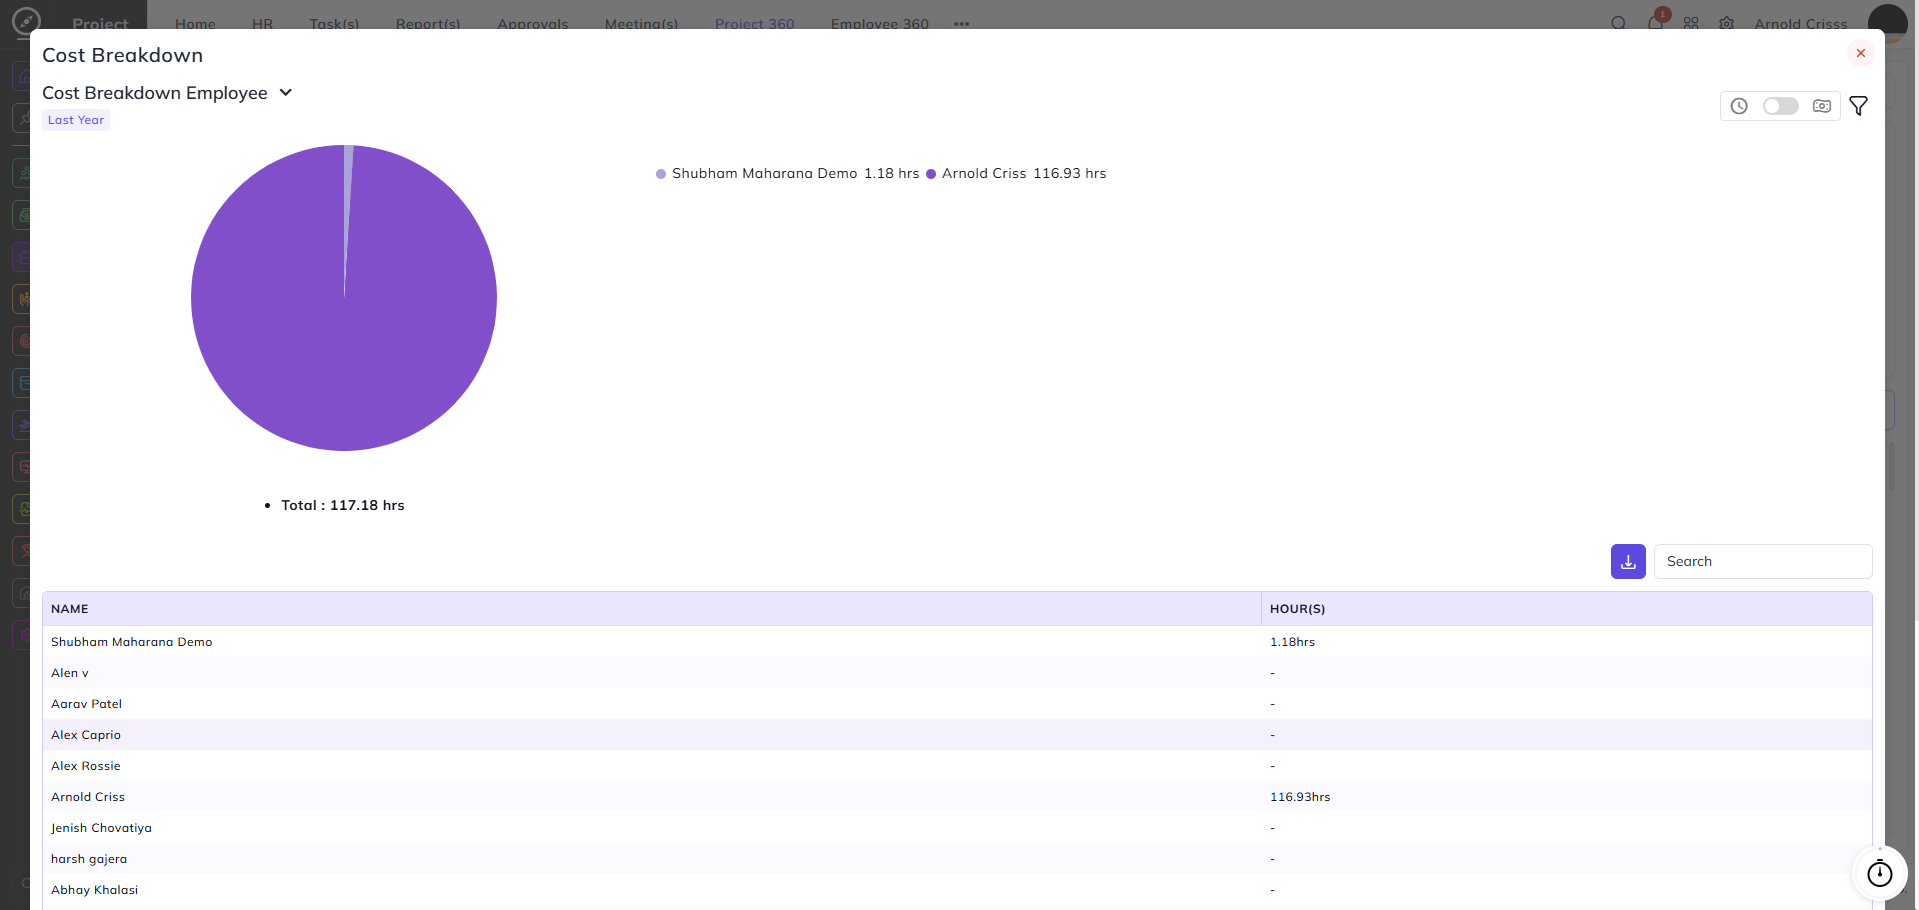
Click the eye icon to open an expanded Cost Breakdown dialog that shows the pie chart along with a detailed table listing each member's name and total hours, with a searchable list and download option. Toggle the Cost Wise switch to switch the chart between displaying hours and displaying cost amounts.
Use the filter icon to change the time period — options include Last 30 Days, Current Month, Last Month, Last Year, Custom, and Till Today.
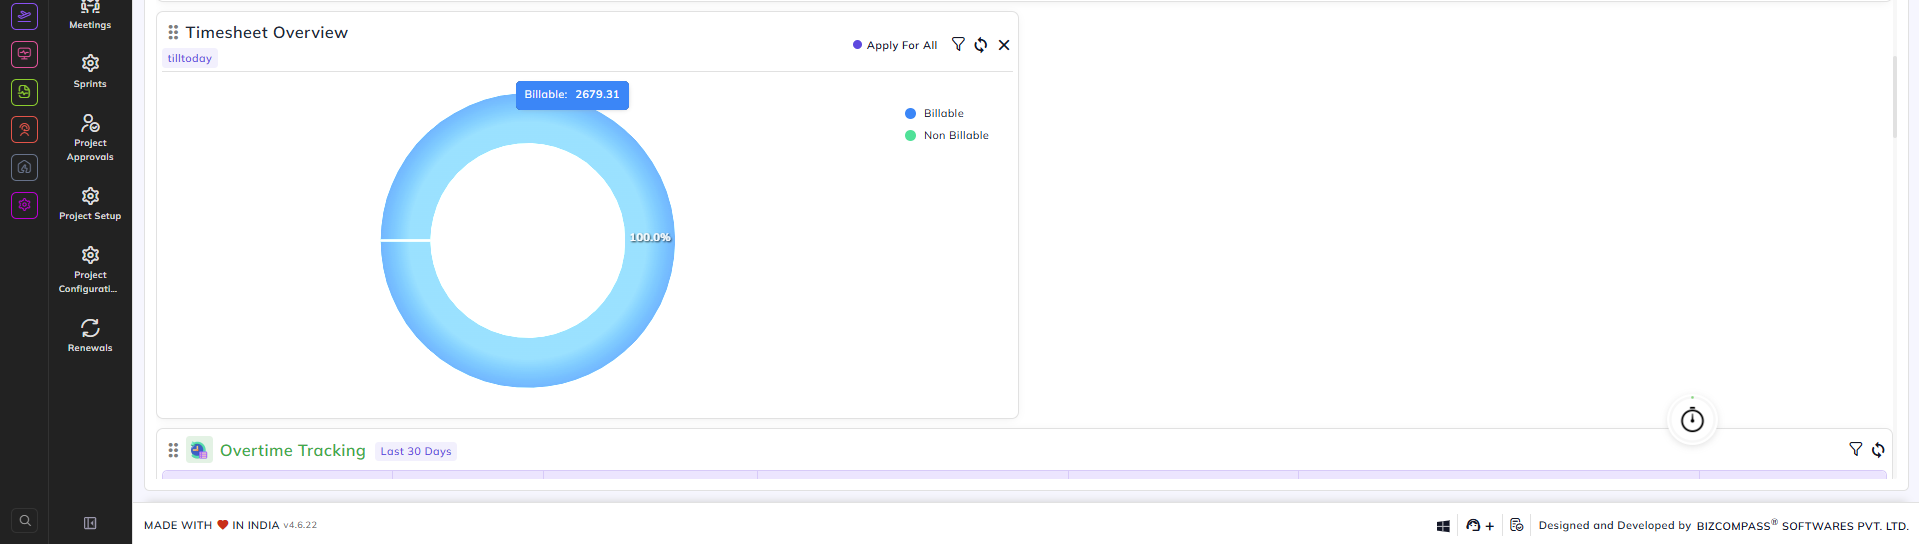
Timesheet Overview:
A donut chart showing the split between Billable and Non-Billable hours logged for the project.
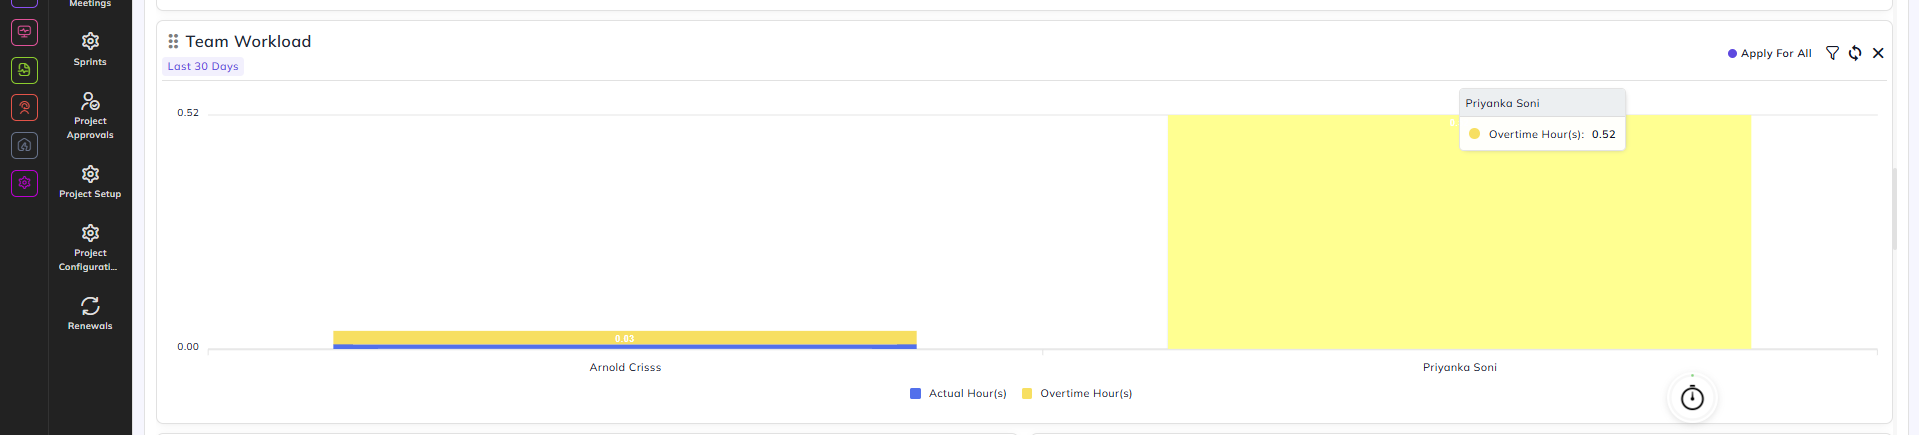
Team Workload:
A bar chart showing Actual Hours versus Overtime Hours per team member over the selected period.
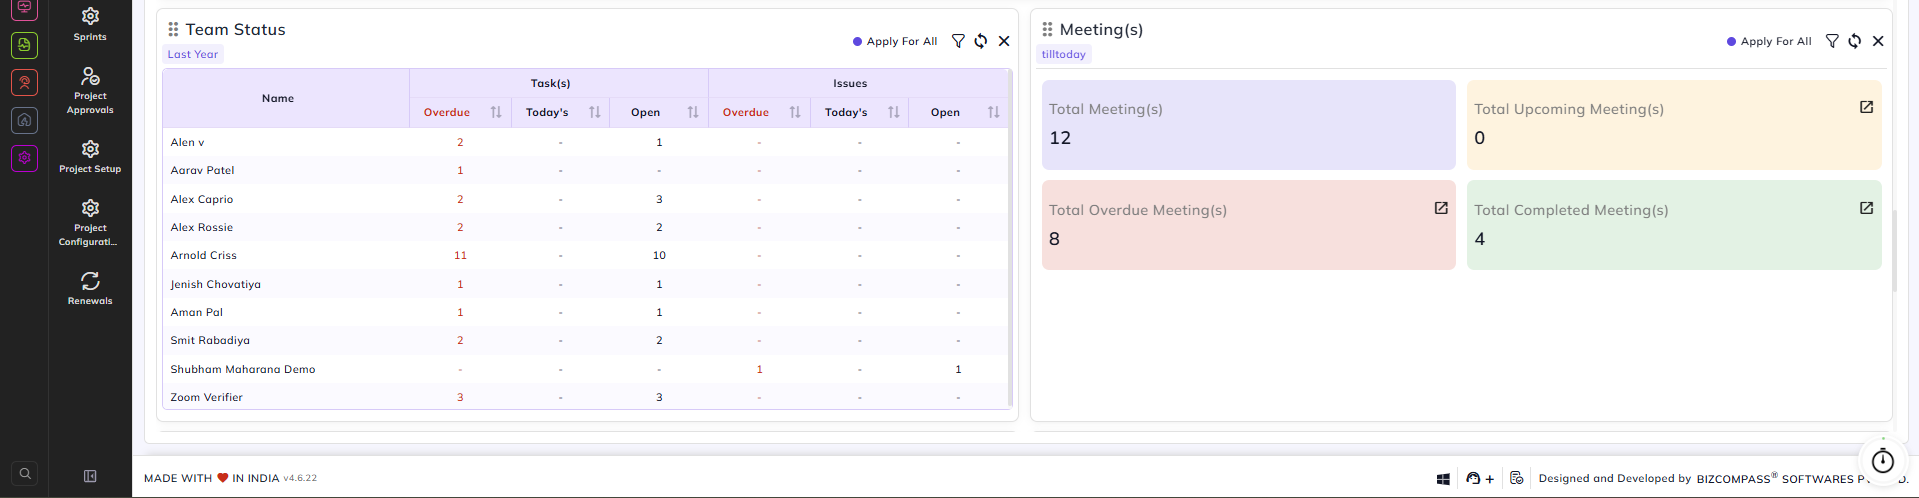
Team Status:
A table listing each team member with their overdue, today's, and open task and issue counts.
Meeting(s):
A summary card showing Total Meetings, Total Upcoming Meetings, Total Overdue Meetings, and Total Completed Meetings for the project.
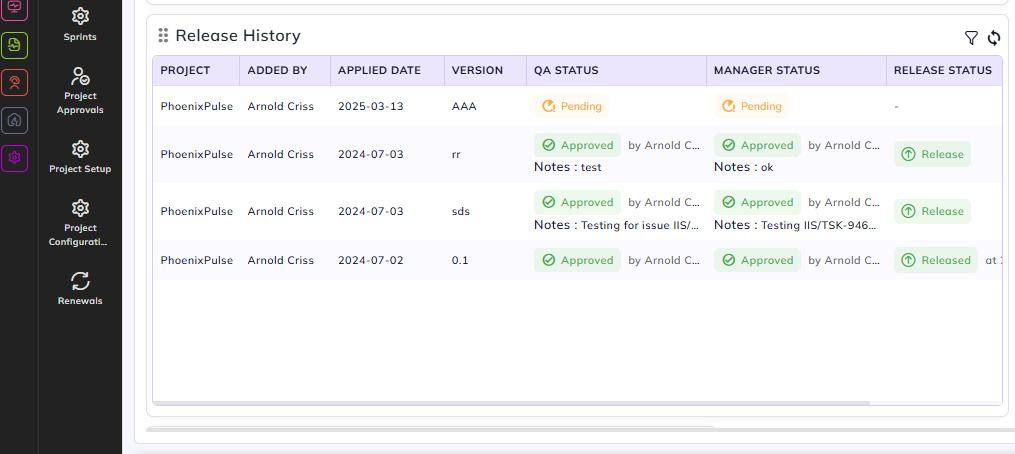
Release History:
Release History table displays all previously created releases for the project, showing the project name, who added the release, the applied date, version number, QA status, manager status, and release status. QA and manager statuses show as Pending or Approved (along with the approver's name and any notes). The release status shows as Released once both approvals are complete.
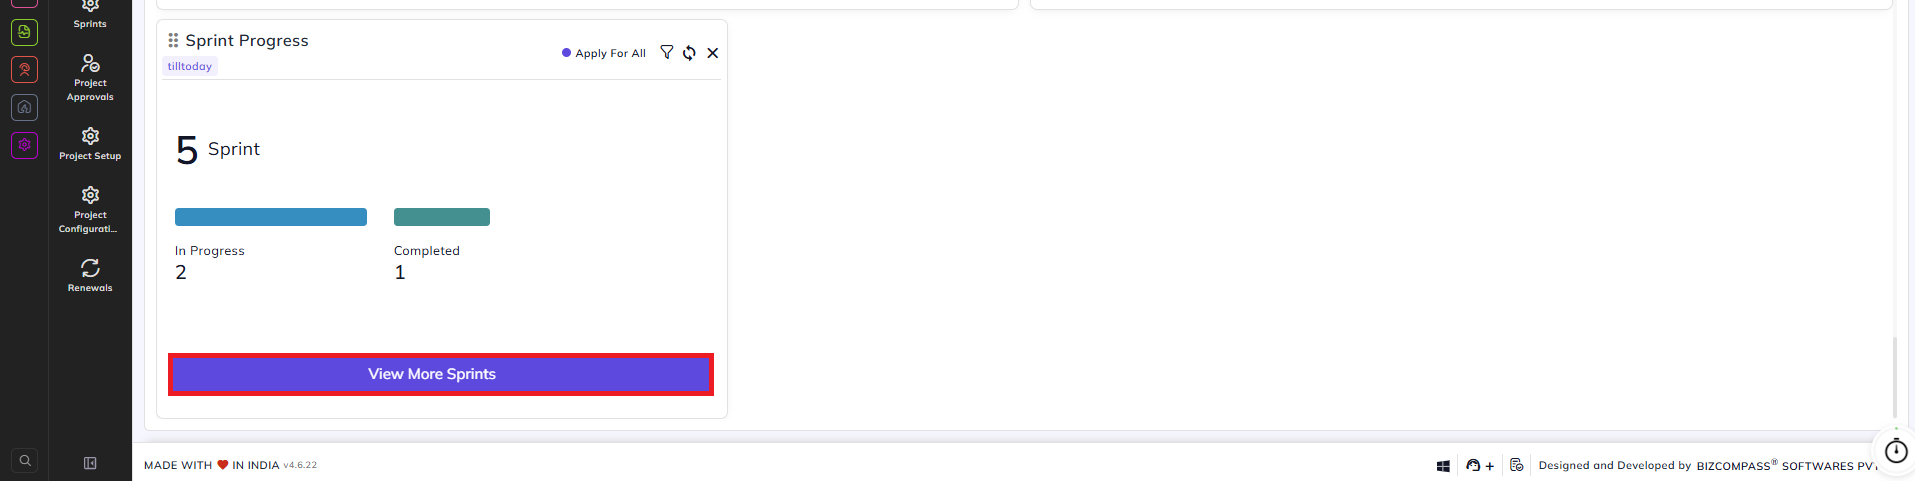
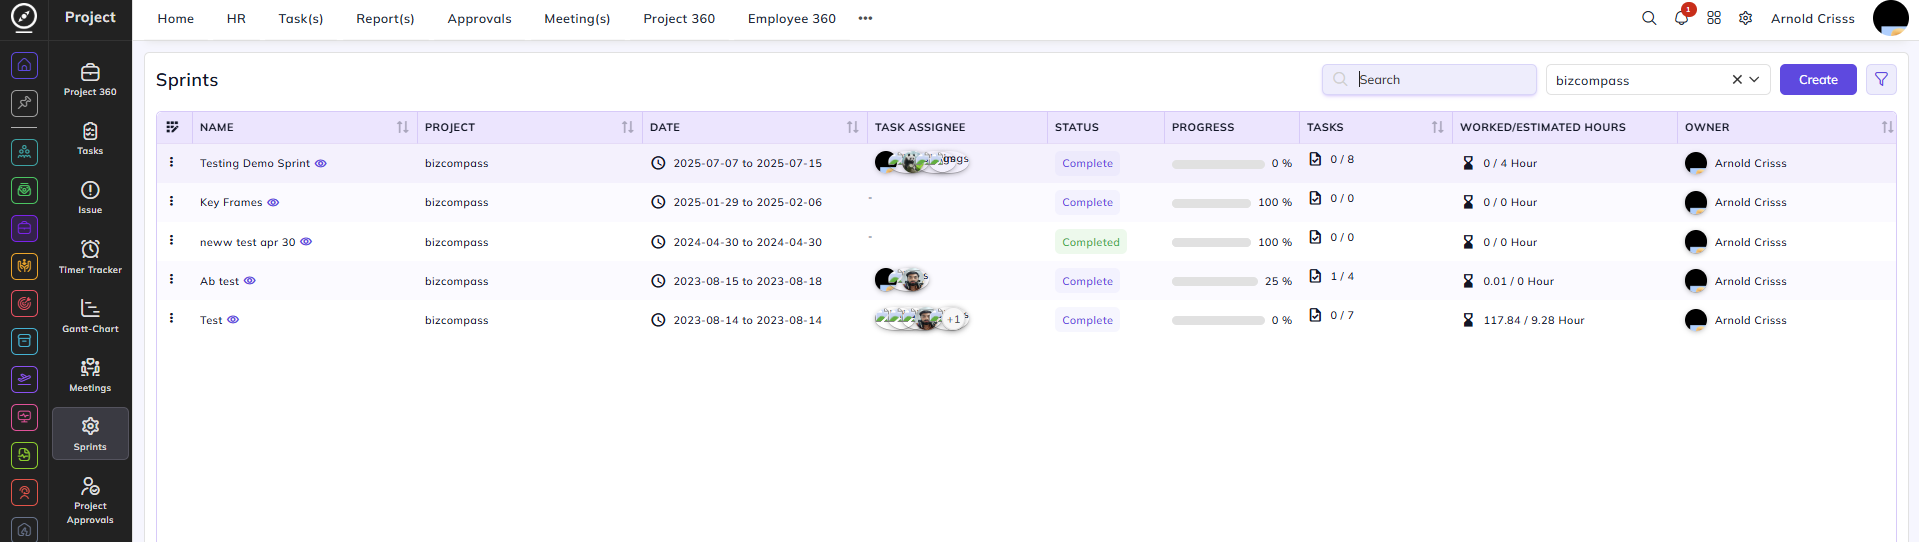
Sprint Progress:
Displays the total number of sprints for the project along with a count of In Progress and Completed sprints. Click View More Sprints to navigate to the full sprint list filtered for this project.
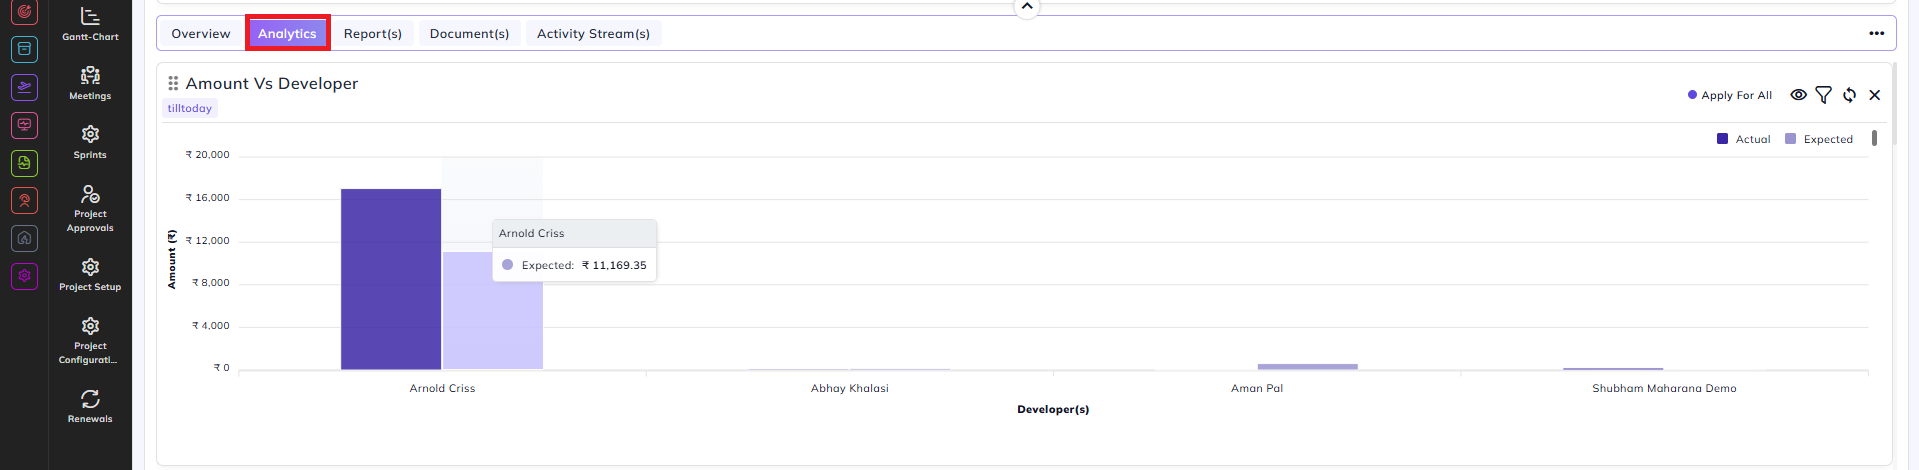
Analytics Tab:
The Analytics tab provides a series of charts for deeper analysis of project performance.
Amount Vs Developer:
A bar chart comparing the actual and expected cost amounts per developer.
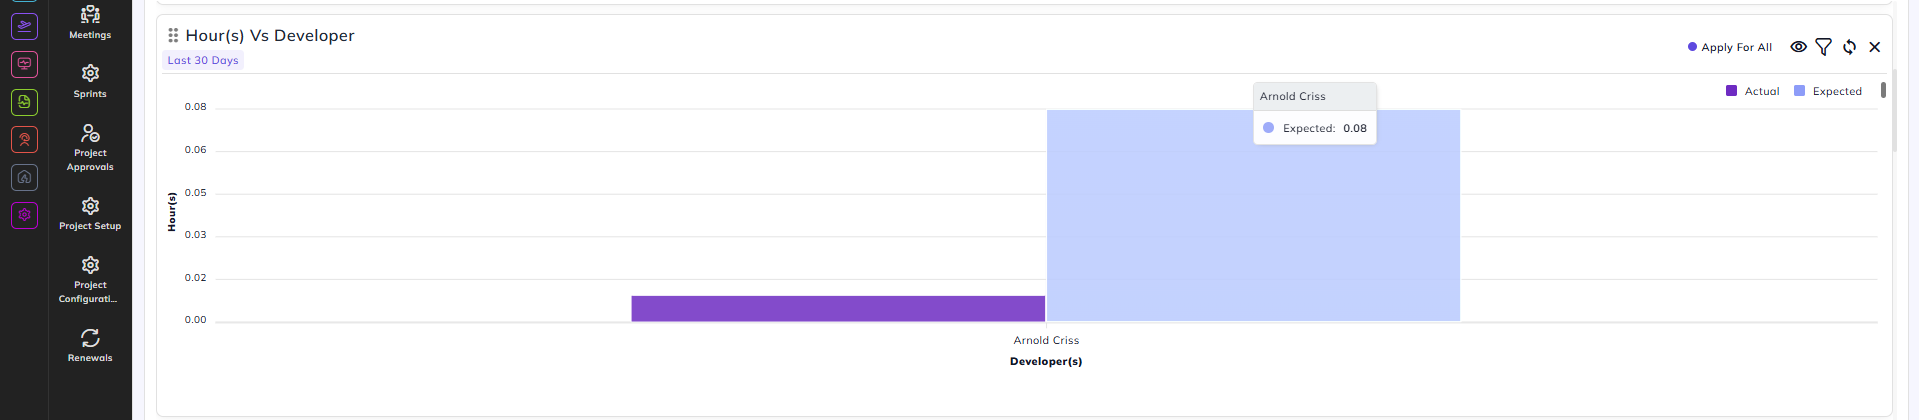
Hour(s) Vs Developer:
A bar chart comparing actual and expected hours per developer.
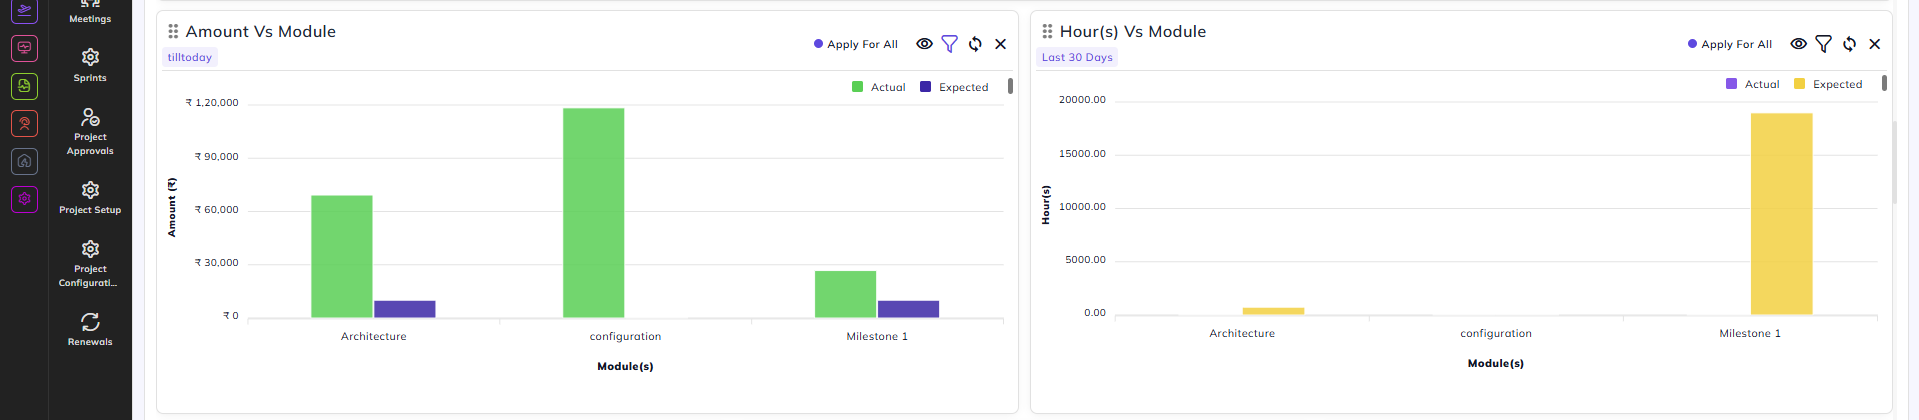
Amount Vs Module:
A bar chart comparing actual and expected cost amounts per module.
Hour(s) Vs Module:
A bar chart comparing actual and expected hours per module.
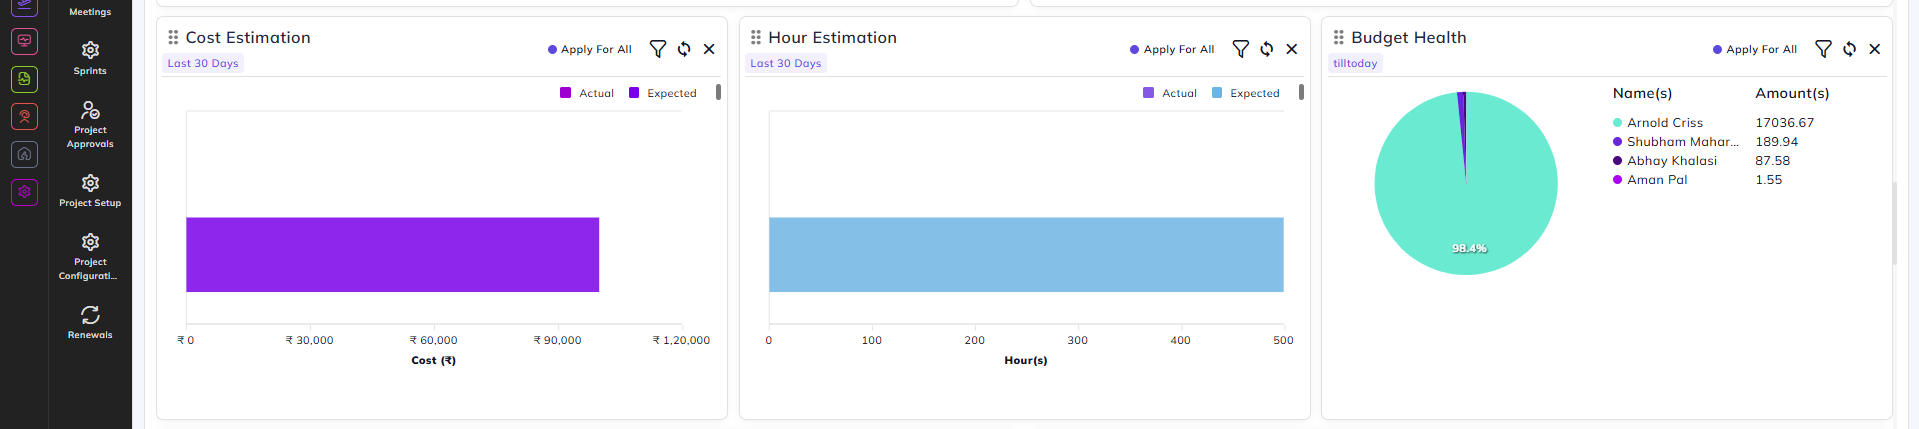
Cost Estimation:
A horizontal bar chart comparing the overall actual versus expected cost for the project.
Hour Estimation:
A horizontal bar chart comparing the overall actual versus expected hours for the project.
Budget Health:
A pie chart showing the budget distribution across team members, with each member's name and amount listed alongside the chart.
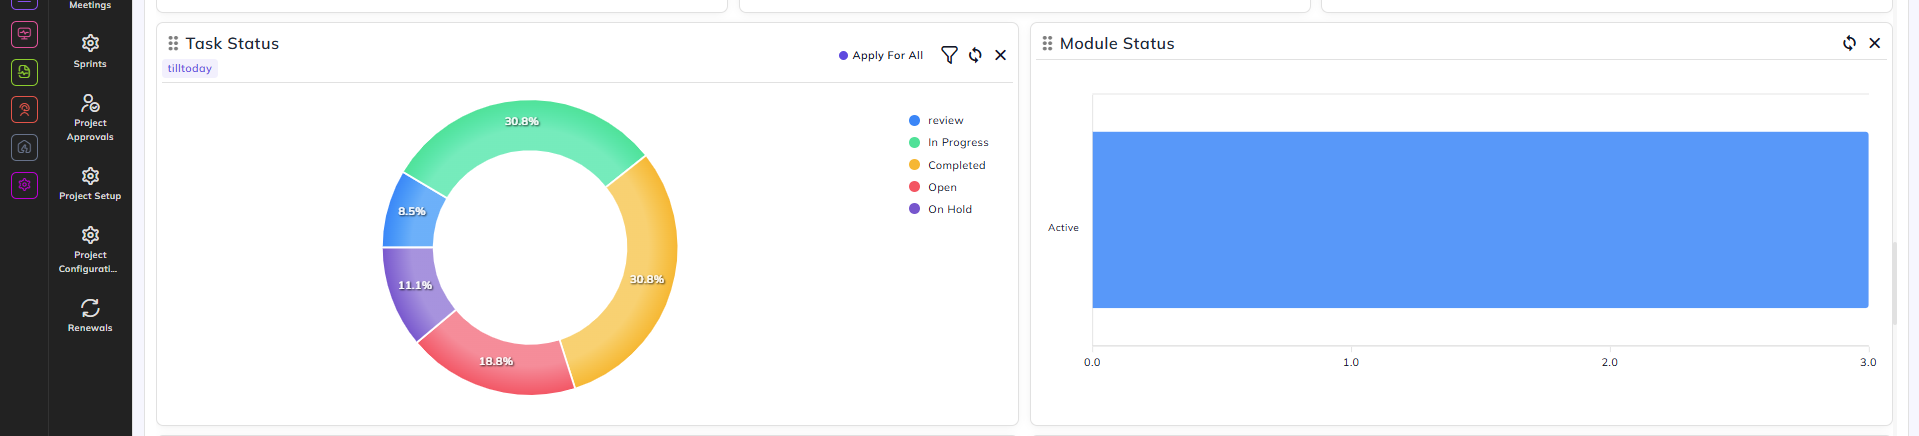
Task Status:
A donut chart showing the percentage breakdown of tasks by status — Review, In Progress, Completed, Open, and On Hold.
Module Status:
A bar chart showing the status of modules within the project.
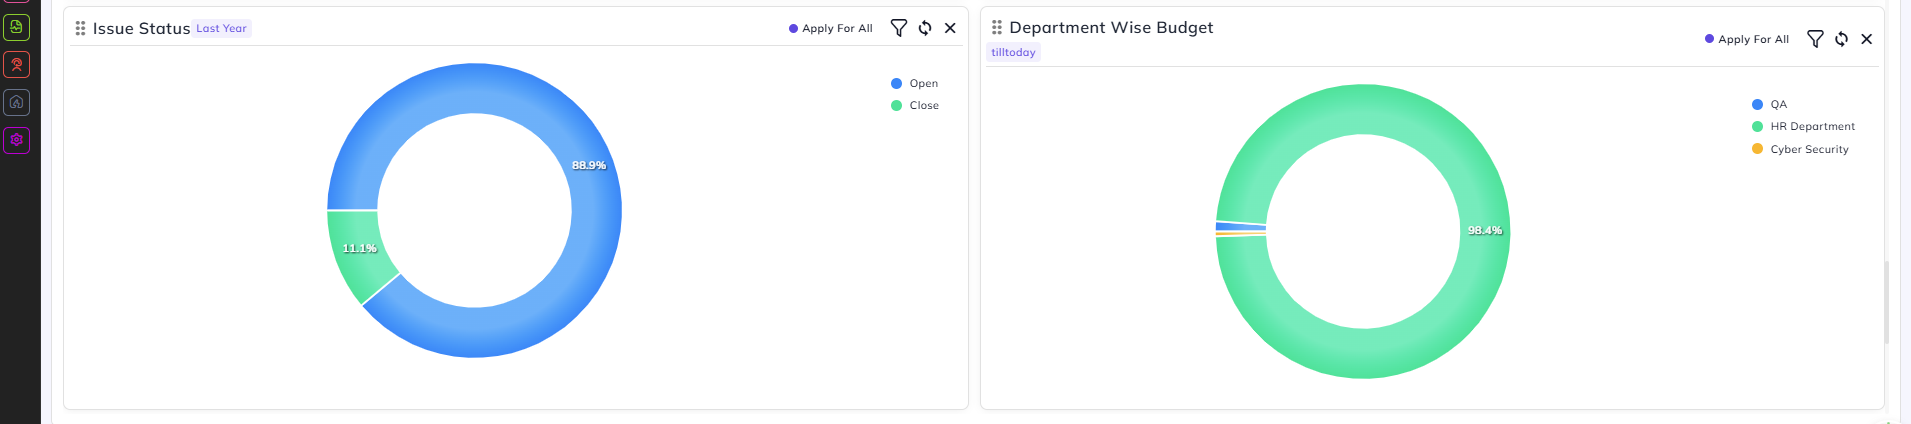
Issue Status:
A donut chart showing the proportion of Open versus Closed issues for the project.
Department Wise Budget:
A donut chart showing budget distribution across departments.
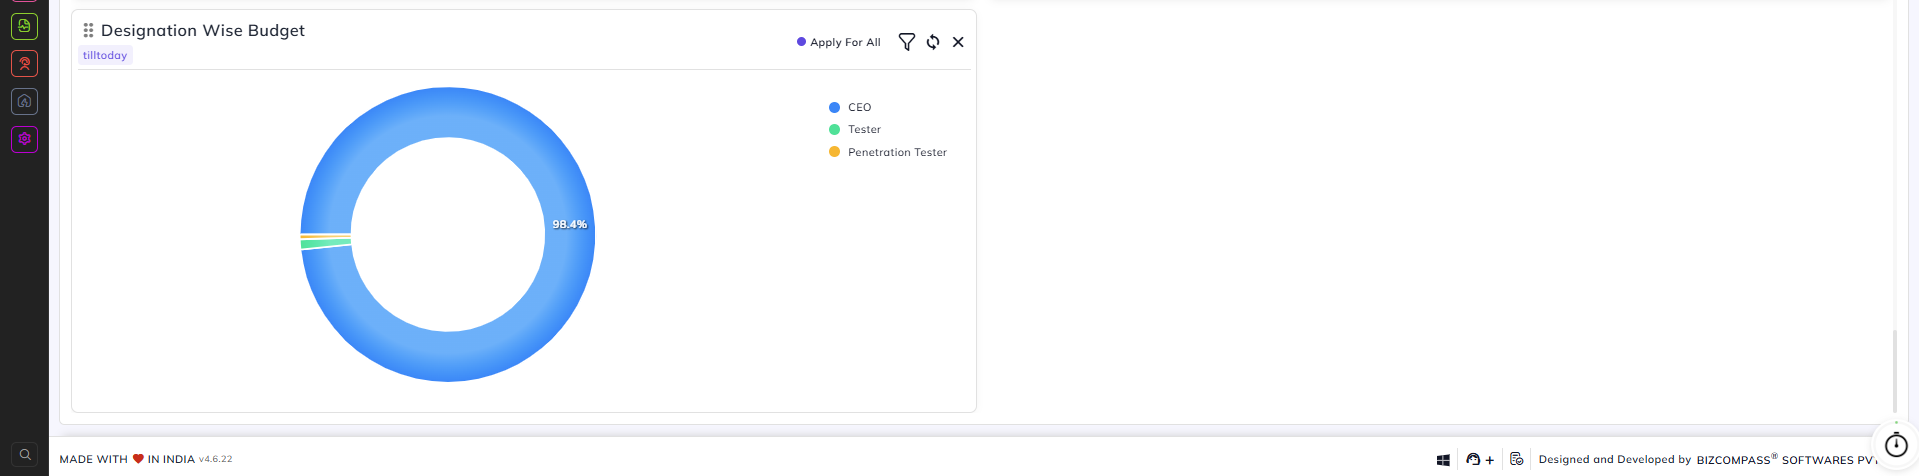
Designation Wise Budget:
A donut chart showing budget distribution across designations.
Report(s) Tab:
The Reports tab provides access to detailed reports for the project across several sub-tabs: Project Report(s), Task Report(s), Issue Report(s), Efficiency, Overtime Report(s), Daily Bucket Report(s), and Cost Report(s).
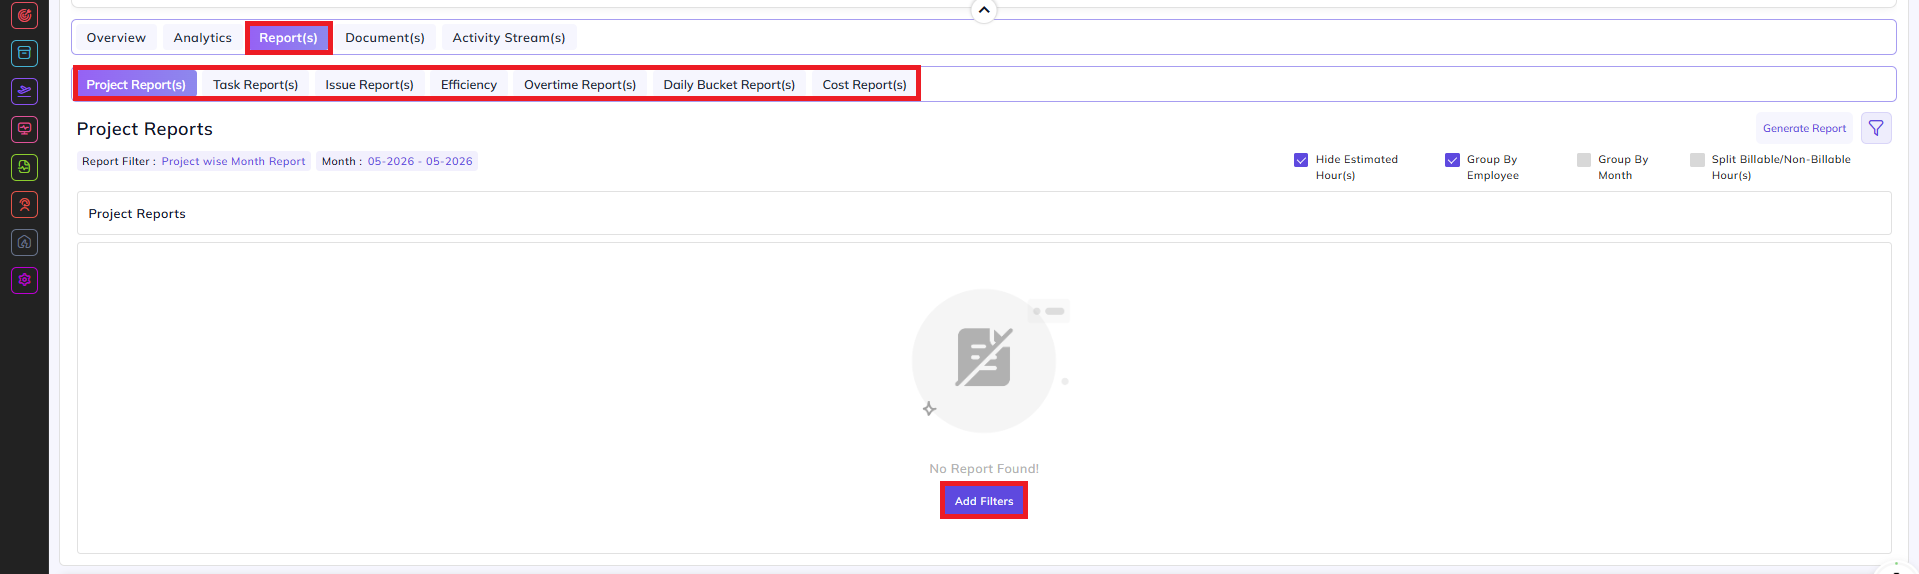
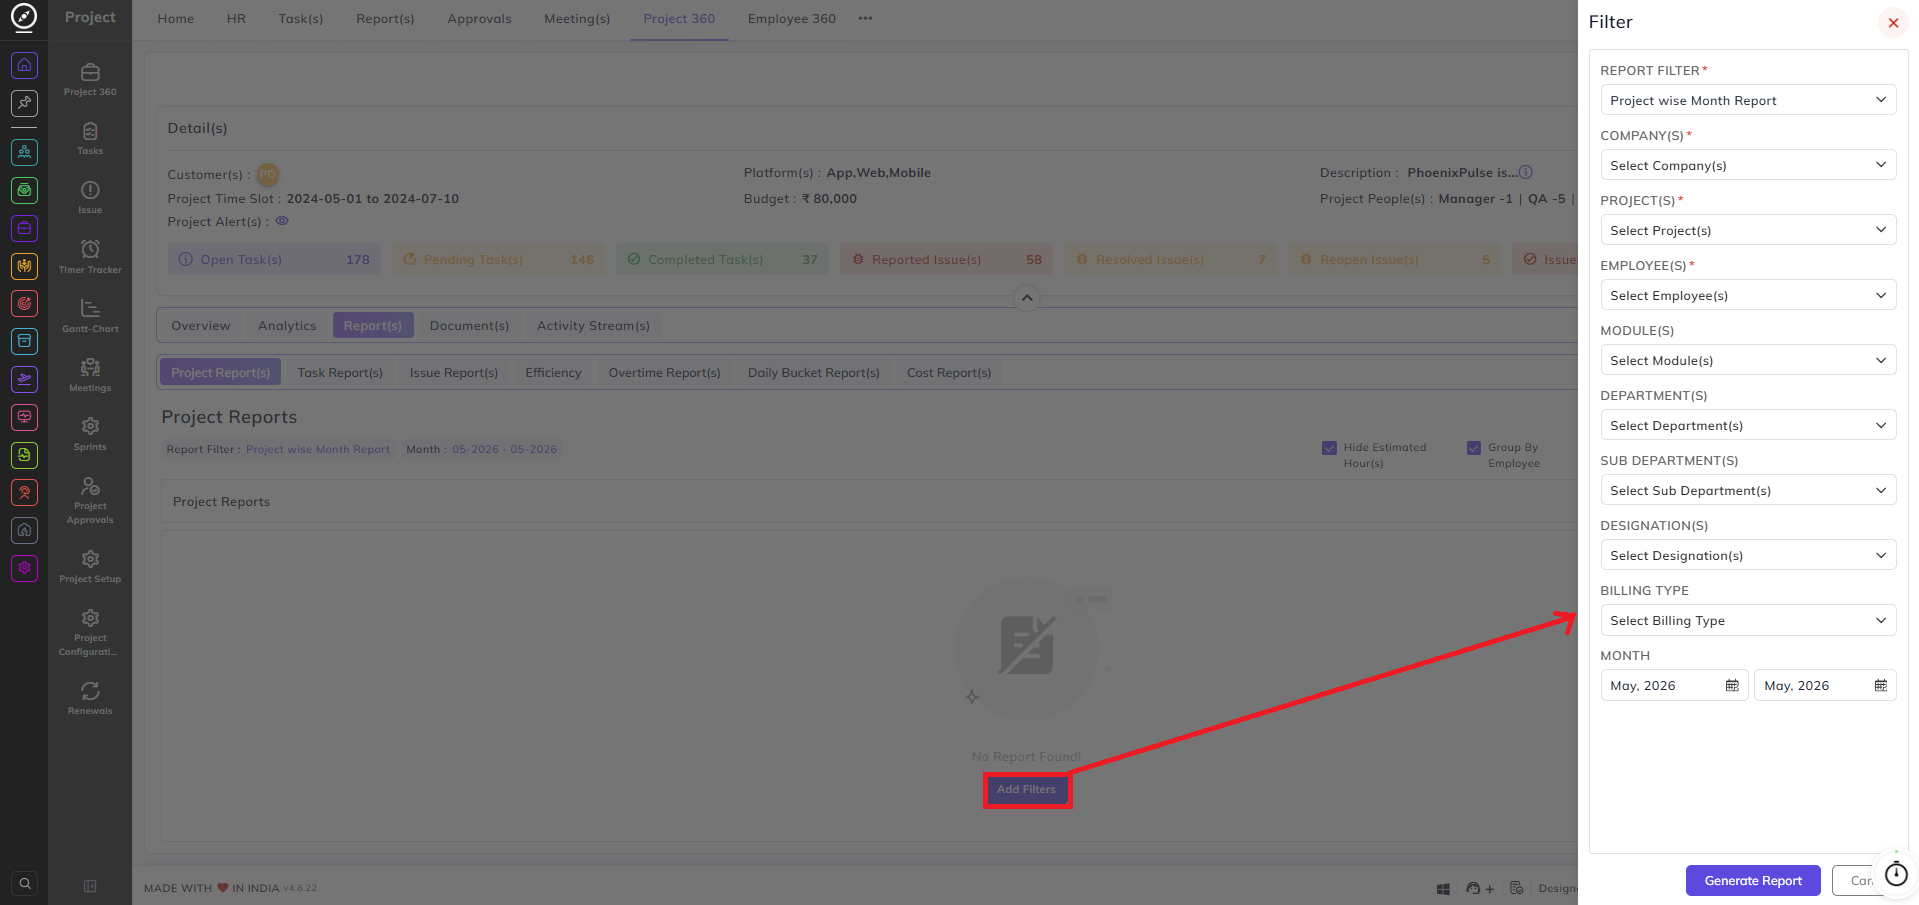
Clicking the filter icon or the Add Filters button opens a Filter panel with the following options:
Report Filter: Select the type of report to generate (e.g., Project wise Month Report).
Company(s): Select the company to filter by.
Project(s): Select the project(s) to include in the report.
Employee(s): Select the employee(s) to filter by.
Module(s): Select the module(s) to filter by.
Department(s): Select the department(s) to filter by.
Sub Department(s): Select the sub-department(s) to filter by.
Designation(s): Select the designation(s) to filter by.
Billing Type: Select whether to filter by Billable or Non-Billable entries.
Month: Set the month range for the report.
Once the filters are configured, click Generate Report to produce the report output.
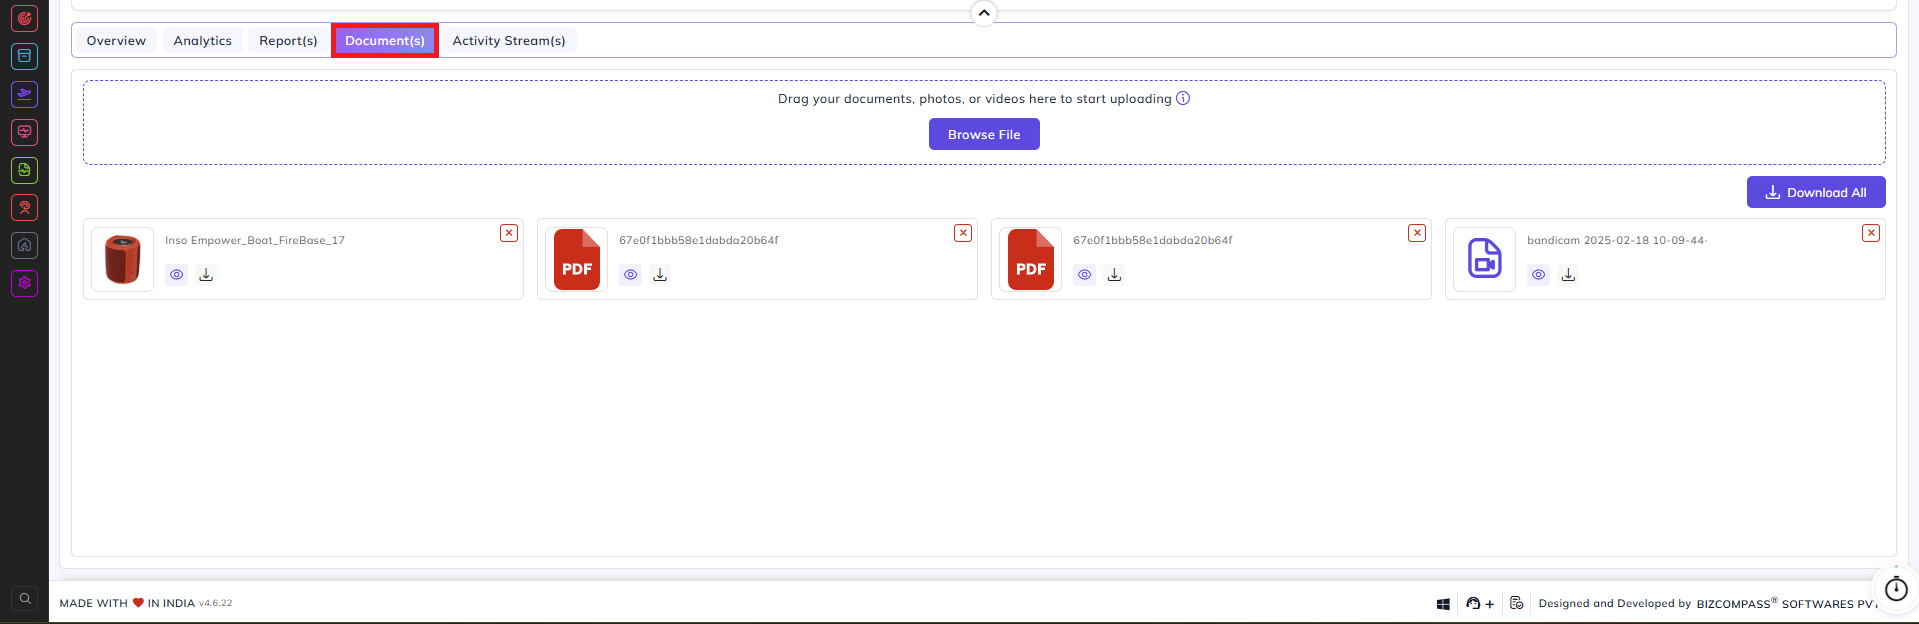
Document(s) Tab:
The Documents tab allows you to upload and manage files related to the project. Drag and drop documents, photos, or videos into the upload area, or click Browse File to select files from your system. Uploaded files are displayed as thumbnail cards. Each file can be previewed using the eye icon or downloaded using the download icon. Click Download All to download all uploaded documents at once.
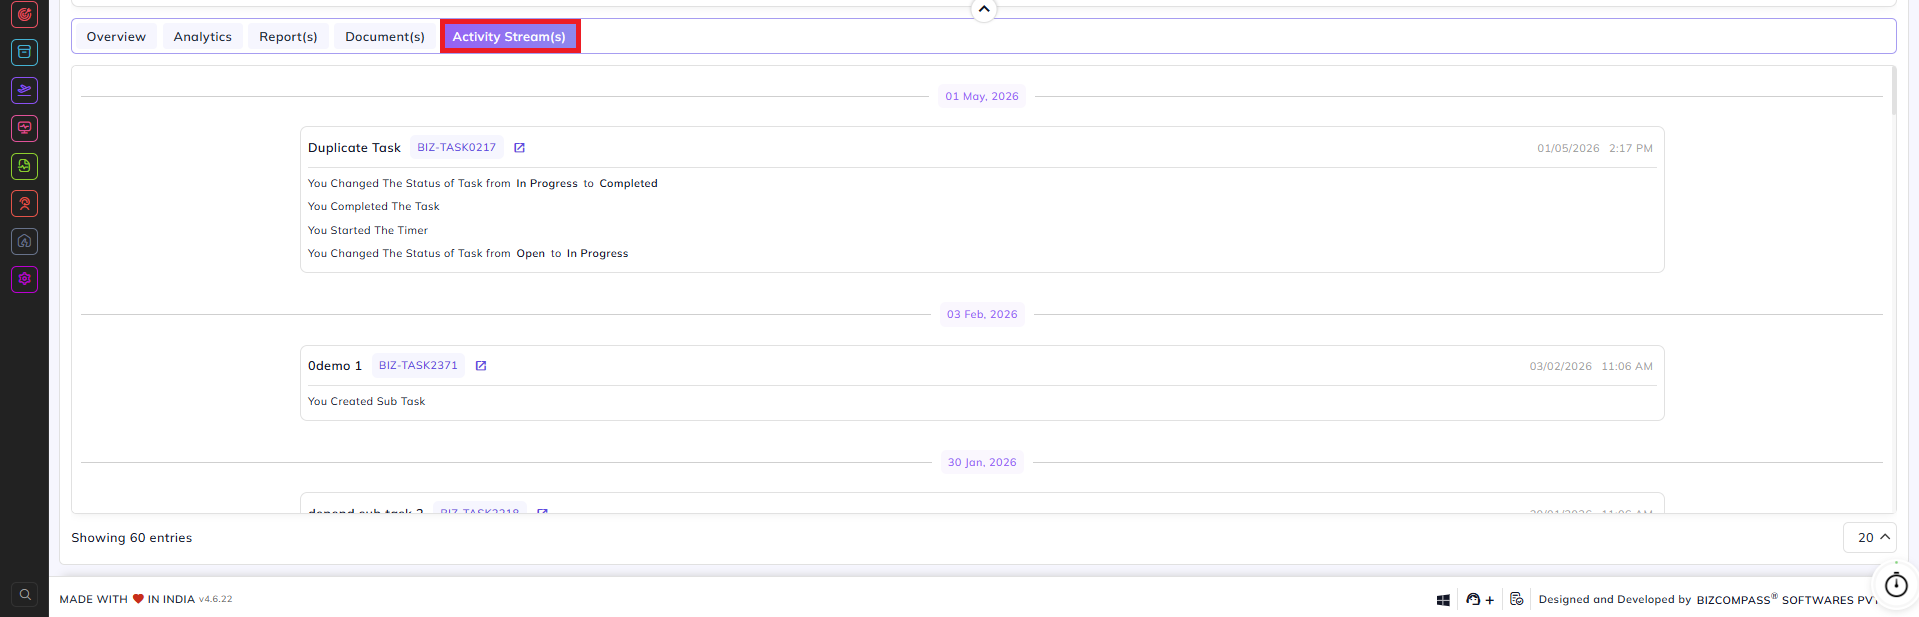
Activity Stream(s) Tab:
The Activity Stream tab displays a chronological log of all actions performed within the project, grouped by date. Each entry shows the task name, task ID, timestamp, and a description of the action taken (e.g., status changes, timer activity, sub-task creation). Click the link icon next to a task ID to navigate directly to that task.